This 3-tipster portfolio is the result of analyzing April 2026’s top Racing and Football tipsters running them through 10,000 Monte Carlo simulations, and ruthlessly cutting the dead weight to optimize returns. Read how this portfolio was developed and optimised →
3 Tipster Portfolio: Recent Performance
➧ Sep 2026 | Profit=£706 | ROI=30.7%
3 Tipster Portfolio: September 2026 Performance
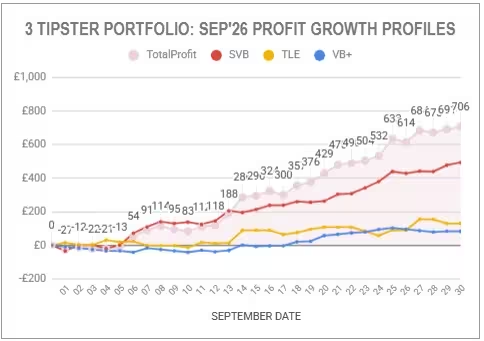
September in Numbers
- Starting Balance: £1,288
- Subscriptions: £97
- Betting Bank: £1,191
- Total Bets: 638
- ROI: 30.7%
- Ending Bank: £1,897
- Month Profit/Loss: £706
- AVERAGE daily percentage of bank at risk in bets was = 5.37%
- MAXIMUM daily percentage of bank at risk in bets was = 7.16%
- SVB max.total staked/day = £50 – Avg.Bet = £5.36
- TLE max. total staked/day = £25 – Avg.Bet = £9.67
- VB+ max. total staked/day = £8.34 – Avg.Bet = £1.51
Reducing tracking from daily to weekly.
➧ Aug 2026 | Profit=£457 | ROI=26%
3 Tipster Portfolio: August 2026 Performance
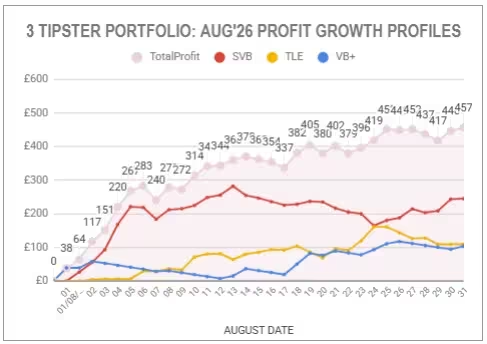
August in Numbers
- Starting Balance: £928
- Subscriptions: £97
- Betting Bank: £831
- Total Bets: 536
- ROI: 26.1%
- Ending Bank: £1288
- Month Profit/Loss: £457
- AVERAGE daily percentage of bank at risk in bets was = 4.94%
- MAXIMUM daily percentage of bank at risk in bets was = 7.00%
- SVB max.total staked/day = £34.90 – Avg.Bet = £6.10
- TLE max. total staked/day = £17.45 – Avg.Bet = £5.72
- VB+ max. total staked/day = £5.82 – Avg.Bet = £1.63
➧ Jul 2026 | Profit=£120 | ROI=7%
3 Tipster Portfolio: July 2026 Performance
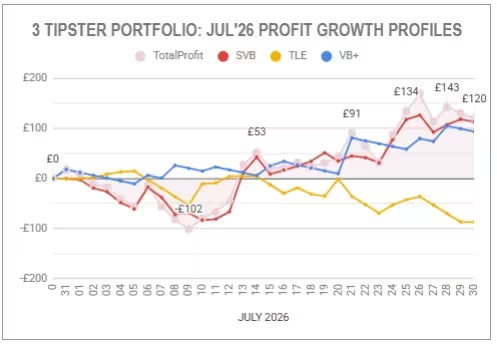
July Strategy
Following the May 2026 performance of this portfolio we decided the model required a ceiling on the percentage of bank risked on a daily basis. For July the maximum daily exposure limit was kept at 7% of bank. The average daily exposure was 6.73% – much more comfortable levels.
July in Numbers
- June Balance: £905
- Subscriptions: £97
- Betting Bank: £808
- Total Bets: 512
- ROI: 7%
- Ending Bank: £928
- Month Profit/Loss: £120
- AVERAGE daily percentage of bank at risk in bets was = 6.73%
- MAXIMUM daily percentage of bank at risk in bets was = 8.21%
- SVB max.total staked/day = £33.94 – Avg.Bet = £6.34
- TLE max. total staked/day = £16.97 – Avg.Bet = £6.64
- VB+ max. total staked/day = £5.66 – Avg.Bet = £1.77
➧ Jun 2026 | Profit=£284 | ROI=27%
3 Tipster Portfolio: June 2026 Performance

June Strategy
Following the May 2026 performance of this portfolio we decided the model required a ceiling on the percentage of bank risked on a daily basis. For June the maximum daily exposure limit was set at 7% of bank. The average daily exposure was 5.5% – much more comfortable levels.
June in Numbers
- Starting Bank: £621
- Total Bets: 576
- ROI: 26%
- Ending Bank: £905
Note: The Betting Bank was £524 after £97 subscriptions were paid.
| Tipster | Expected Win Rate | Actual Win Rate | Expected ROI | Actual ROI | Performance |
| SVB Tips | 33% | 37% | 27% | 21% | High WR / Expected Variance |
| TLE | 40% | 38% | 15% | 28% | High Volume / Big Over-perf |
| ValueBet+ | 11% | 8% | 46% | 32% | High Vol / Slight Under-perf |
| TOTAL | 28% | 26% | 31% | 27% | On Target |
Month Profits
Total profit for the month was £284. The fund currently sits at £905 – this pays for next month’s subscriptions (£97) and leaves £808 in the betting bank for June.Month Risks
The percentage of bank staked on any one day was: Maximum: 7% on Monday 1st June when there were 16 tips from the portfolio. Minimum: 3.2% – some days had zero tips from two of the three tipsters. Average: 5.5% – very much in line with May’s 5.3% average.Comparison Of Staking Approaches
The May comparison of staking approaches showed 1/4 Kelly Adjusted Weekly staking by far the most profitable. However, I’m personally not keen on the high variance that Kelly staking brings so this months figures are based on maximum daily exposure calculated at the start of the month and kept fixed throughout the month. In practcical terms this was a maximum of £36 staked each day across all three tipsters in a 60%, 30%,10% proportion.Conclusion & Next Steps
May and June results align closely with the Monte Carlo simulation findings and are futher step forward in validating my approach.| Tipster | Exp.Win Rate | Act.Win Rate | Exp. ROI | Act. ROI | Performance |
| June | 28% | 26% | 31% | 27% | On Target |
| May | 28% | 28% | 31% | 26% | On Target |
July Strategy
Only changes are the total stake risked per day increases in line with the increase in the betting bank.
➧ May 2026 | Profit=£218 | ROI=26%
3 Tipster Portfolio: May 2026 Performance
May 2026 was the “proof of concept” month for the Mixed Sport Portfolio, and the results were a reassuring validation of the model. Starting with a modest £500 fund and using “micro-stakes” designed to stay under the bookies’ radar, the portfolio delivered a £218 profit – a 26% ROI.
The most fascinating takeaway? The win rate (28%) and returns landed almost exactly where our Monte Carlo simulations predicted.
The Month in Numbers
- Starting Bank: £500 (£403 after £97 subscriptions)
- Total Bets: 572
- Return on Investment (ROI): 26%
- Ending Bank: £621 (Heading into June with £524 after fees)
While SVB over-delivered on win rate and VB+ saw a surge in tip volume (7/day vs. the expected 4), the portfolio’s diversification smoothed out the bumps.
The Month in Pictures


| Tipster | Expected Win Rate | Actual Win Rate | Expected ROI | Actual ROI | Performance |
| SVB Tips | 33% | 43% | 27% | 26% | High WR / Stable ROI |
| TLE | 40% | 36% | 15% | 17% | High Volume / Slight Over-perf |
| ValueBet+ | 11% | 9% | 46% | 40% | High Vol / Expected Variance |
| TOTAL | 28% | 28% | 31% | 26% | On Target |
Month Profits
Total profit for the month was £218. The bank currently sits at £621 giving us a 26% ROI and a 43% Return On Capital (ROC) in a single month. This pays for next month’s subscriptions (£97) and leaves £524 in the betting bank for June.Month Risks
The percentage of bank staked on any one day was: Maximum: 17% on Saturday 2nd May when there were 46 tips from the portfolio. While the strategy has no hard cap, this felt high. Minimum: 1% – some days had zero tips from two of the three tipsters. Average: 5.3% – the generally accepted wisdom is to only risk 1 – 2% of your betting bank on tipsters – but we are not following a single set of tips – we are following a well-designed portfolio here with a Monte Carlo simulated maxiumum drawdown of 40 units and a risk of ruin of less than 0.01% on a 200 unit bankroll.Comparison Of Staking Approaches
The table compares the following staking approaches:- Fixed Stakes every day.
- Stakes adjusted weekly based on percentage increase/decrease of available betting bank.
- 1/4 Kelly Staking starting with bank split equally between the three tipsters (£134.33 each) and adjusted weekly.
| Element | Stakes Fixed all month | Stakes Adj. Wkly | 1/4 Kelly Adj. Wkly |
| SVB Stake | 2.62 | 2.62 – 4.22 | £4.40 – £15.66 |
| TLE Stake | 1.31 | 1.31 – 2.11 | £2.35 – £3.11 |
| VB+ Stake | 0.44 | 0.44 – 0.70 | £1.37 – £3.29 |
| Stakes | £826 | £1,033 | £2,698 |
| Profit | £218 | £262 | £538 |
| ROI | 26% | 25% | 20% |
The results tell a story of risk vs. reward:
- Fixed Stakes: £218 profit (26% ROI). The “slow and steady” baseline.
- Weekly Adjusted: £262 profit (25% ROI). Compounding in action.
- 1/4 Kelly (Adjusted weekly): £538 profit (20% ROI). Huge upside, but high volatility—including a £210 drawdown in the final week – that’s nearly 33% gone in a week .

Conclusion & Next Steps
May results align closely with the Monte Carlo simulation findings and are a significant step forward in validating my approach.June Strategy
The model works, but the human element (and the bookie’s eye) requires a ceiling. For June, I am reviewing a Daily Exposure Cap – perhaps 10 – 12%. If the tip volume exceeds this, stakes will be scaled proportionally to maintain the mathematical edge without the ‘Black Swan’ risk.
➧ Historical Backtested months (8)
| Historical Backtested months (8) | Profit/Loss (Units) | ROI |
| Apr 2026 | 922 | 19% |
| Mar 2026 | 1,354 | 34% |
| Feb 2026 | 1,047 | 31% |
| Jan 2026 | 277 | 11% |
| Dec 2025 | 889 | 52% |
| Nov 2025 | 532 | 30% |
| Oct 2025 | 259 | 6% |
| Sep 2025 | -249 | -6% |