Tipstrr will be publishing their April Best Football Tipsters article soon – but I wanted to get ahead of it with my own independent analysis to see how it stacks up.
This isn’t just a monthly snapshot. I’m breaking down performance across four timeframes – the last 1 month, 3 months, 6 months, and 12 months – giving you the equivalent of Tipstrr’s Monthly, Quarterly, Half-Year, and Annual Roundups all in one place, every single month.
And there’s a bonus: I’ve also identified the tipsters who made the top 20 ROI list across all three of the 3-month, 6-month, and 12-month tables simultaneously – the closest thing to a true consistency benchmark this data can offer.
TL;DR — What Actually Matters From This Post
If you only read one section, read this 👇
1. Short-term (1M) = noise, not reliability
- High ROI here is often luck + variance
- Good for spotting who’s active, not who’s profitable long-term
2. 3-month = early signals, but still risky
- Some patterns emerge
- Still too early to trust — many “top” performers will regress
3. 6-month = first real test
- Weak systems start to drop off
- Consistent strategies begin to show
- This is where credibility starts
4. 12-month = truth
- Separates real edge vs short-term hype
- Long-term winners = those who survive variance cycles
The Only Tipsters That Actually Matter
Across all timeframes, very few names consistently perform:
👉 These are the only genuinely “proven” profiles in the dataset.
What Differentiates Them
- Balanced edge (best):
- The Least Expected, UDIMan
→ Repeatable, stable performance
- The Least Expected, UDIMan
- Efficiency leader:
- Clean Sheet Merchant
→ High ROI, but slightly lower volume
- Clean Sheet Merchant
- Volume-driven system:
- SVB Tips
→ Profit comes from scale, not edge per bet
- SVB Tips
Biggest Traps to Avoid
- 🚫 Chasing 1-month ROI leaders
- 🚫 Trusting high odds / low win-rate systems without long-term proof
- 🚫 Confusing profit spikes with skill
The Real Strategy
If your goal is profit:
👉 Focus ONLY on tipsters who:
- Perform across 6M + 12M
- Maintain consistent ROI (not spikes)
- Show repeatability, not just peaks
Bottom Line
- Most tipsters = temporary winners
- A few tipsters = structurally profitable
- Almost none = consistent across all conditions
👉 The edge is not finding winners —
it’s filtering out everyone else.
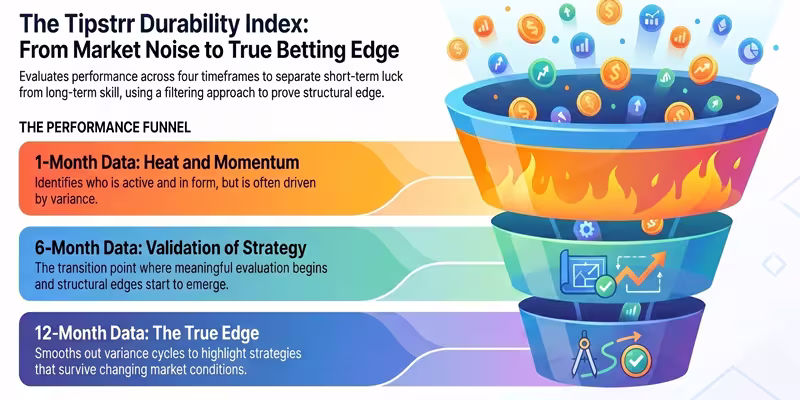
1-Month Table Narrative – “Heat, Momentum and Early Noise”
The 1-month data is where performance often looks most dramatic, and where interpretation is most dangerous. This is the stage where short winning streaks can heavily inflate ROI and make emerging tipsters appear more consistent than they really are.
For example, early momentum from tipsters like Footy Star, SVB Tips, and The Least Expected can look extremely strong in isolation. However, this is often driven by variance rather than structural edge.
At this stage, even smaller-volume but high-odds operators like C3S or niche models like TriBTTS can appear dominant due to the nature of short-term betting swings.
The key takeaway from the 1-month dataset is simple:
👉 It identifies who is active and in form, not who is reliable.
This table is best viewed as a signal generator, not a decision tool.
Top ROI Tipsters (Last 1 Month snapshot)
| Rank | Tipster | ROI | Avg Odds | Tips/Week | Win Rate | Profit |
|---|---|---|---|---|---|---|
| 1 | Clean Sheet Merchant | 54.75% | 2.57 | 5 | 60% | 109.50 |
| 2 | Footy Star | 54.3% | 2.89 | 8 | 53% | 173.80 |
| 3 | MLS Value | 51.21% | 2.20 | 4 | 69% | 81.90 |
| 4 | EA Daily | 43.12% | 1.73 | 4 | 82% | 72.81 |
| 5 | empates9 team | 42.17% | 3.80 | 8 | 37% | 127 |
| 6 | GAMESDRAWS | 36.61% | 14.34 | 51 | 33% | 1351.39 |
| 7 | The LOW Service | 30.56% | 5.06 | 8 | 43% | 146.50 |
| 8 | star tips | 27.15% | 2.85 | 12 | 44% | 135.80 |
| 9 | TriBTTS | 26.31% | 10.58 | 17 | 44% | 348.31 |
| 10 | Vic777 | 26.17% | 1.89 | 5 | 67% | 55 |
| 11 | Match Maker | 25.52% | 1.79 | 6 | 50% | 56.67 |
| 12 | Fran’s super tips | 24.6% | 4.22 | 13 | 33% | 127.90 |
| 13 | TOP BET TIPS | 24.39% | 2.14 | 7 | 58% | 63.40 |
| 14 | Alex Bruno Jubanski | 24% | 2.04 | 4 | 56% | 43.33 |
| 15 | Real FC Tips | 22.46% | 1.86 | 8 | 67% | 74.10 |
Key Observations (1-Month Dataset)
- Extremely high short-term ROI at the top is driven by variance + small sample effects
- High-volume systems like GAMESDRAWS and Lulas BTTS dominate profit but not efficiency
- Low-volume, high-win-rate models (e.g. EA Daily, MLS Value) show more “controlled” returns
- Mid-tier clustering (15–25% ROI range) contains the majority of structurally balanced systems
3-Month Table Narrative – “Emerging Patterns and False Confidence”
By three months, the dataset begins to stabilise slightly. This is where performance clusters form and where some tipsters begin to separate themselves from pure variance.
Names like UDIMan, Clean Sheet Merchant, and The Least Expected often stand out with more structured ROI profiles and repeatable betting logic.
However, this is also the stage where overconfidence becomes a risk. Tipsters such as The LOW Service may look highly attractive due to strong short-to-medium term returns, even though longer datasets later reveal regression.
Volume-heavy models like SVB Tips also start to show their dual nature here — strong cumulative profit, but dependent on sustained betting throughput rather than pure edge.
At this stage, the purpose of the data is filtering, not selecting.
👉 It reveals patterns worth watching, not conclusions worth acting on.
Top ROI Tipsters (Last 3 Months – short-term)
| Rank | Tipster | ROI | Avg Odds | Tips/Week | Win Rate | Profit |
|---|---|---|---|---|---|---|
| 1 | Footy Star | 32.31% | 2.80 | 9 | 46% | 336 |
| 2 | Vic777 | 26.82% | 1.89 | 5 | 63% | 172 |
| 3 | UDIMan | 26.74% | 2.03 | 5 | 61% | 165.80 |
| 4 | Fran’s super tips | 24.23% | 4.94 | 9 | 32% | 271.40 |
| 5 | star tips | 23.19% | 2.74 | 14 | 44% | 403.60 |
| 6 | Clean Sheet Merchant | 21.27% | 2.66 | 6 | 47% | 155.30 |
| 7 | The Least Expected | 21.14% | 3.26 | 15 | 37% | 393.30 |
| 8 | TOP BET TIPS | 20.94% | 2.22 | 7 | 54% | 173.80 |
| 9 | Real FC Tips | 19.85% | 1.86 | 8 | 63% | 198.50 |
| 10 | SVB Tips | 19.42% | 2.80 | 29 | 45% | 703 |
| 11 | Smart Football | 19.22% | 3.31 | 15 | 37% | 345.90 |
| 12 | C3S | 17.64% | 10.37 | 20 | 12% | 434 |
| 13 | fussi_ev | 16.06% | 2.82 | 4 | 46% | 74 |
| 14 | TriBTTS | 15.14% | 9.94 | 18 | 38% | 599.15 |
| 15 | Nerbass | 14.71% | 1.98 | 5 | 52% | 85.30 |
6-Month Table Narrative – “Validation of Strategy”
The 6-month view is where meaningful evaluation begins. By now, most purely variance-driven performances have corrected, and true structural edges start to emerge.
Tipsters such as The Least Expected, UDIMan, and Clean Sheet Merchant show sustained profitability, with ROI and profit metrics that remain robust across changing conditions.
Similarly, consistent performers like Tipingmaster and Real FC Tips demonstrate stable but lower-yield systems, prioritising consistency over volatility.
At the same time, the 6-month data exposes fragility in earlier “hot” performers. Tipsters such as Footy Star show clear regression, while others like Nerbass begin to flatten in ROI.
This table represents a key transition point:
👉 from interesting results to credible performance history.
Top ROI Tipsters (Last 6 Months – medium-term)
| Rank | Tipster | ROI | Avg Odds | Tips /Week | Win Rate | Profit |
|---|---|---|---|---|---|---|
| 1 | The Least Expected | 22.96% | 3.24 | 15 | 38% | 851.80 |
| 2 | The LOW Service | 22.12% | 5.37 | 8 | 43% | 761.00 |
| 3 | TOP BET TIPS | 19.34% | 2.40 | 5 | 53% | 207 |
| 4 | The BTTS Fallacy | 18.83% | 2.79 | 5 | 43% | 216.50 |
| 5 | fussi_ev | 16.51% | 3.04 | 4 | 39% | 170 |
| 6 | UDIMan | 16.38% | 2.03 | 4 | 58% | 150.70 |
| 7 | SVB Tips | 16.2% | 2.86 | 23 | 43% | 928.60 |
| 8 | Nerbass | 15.41% | 1.97 | 4 | 53% | 141.80 |
| 9 | Clean Sheet Merchant | 14.37% | 3.18 | 6 | 38% | 191.20 |
| 10 | Footy Star | 10.85% | 2.64 | 10 | 41% | 264.70 |
| 11 | GAMESDRAWS | 10.14% | 13.92 | 44 | 27% | 1999.01 |
| 12 | Bartys | 10.03% | 2.42 | 7 | 49% | 167.60 |
| 13 | C3S | 9.59% | 10.13 | 20 | 11% | 472 |
| 14 | Mareo Tips Premium | 9.29% | 1.75 | 8 | 62% | 173.08 |
| 15 | Football Head Start | 8.68% | 1.93 | 4 | 56% | 85.11 |
12-Month Table Narrative – “True Edge vs Sustainable Systems”
The 12-month dataset is where performance becomes meaningful in a structural sense. This timeframe smooths out variance cycles and highlights which strategies survive across changing conditions.
Here, long-term leaders such as Clean Sheet Merchant, The Least Expected, and UDIMan demonstrate durability that short-term datasets cannot fully capture.
Meanwhile, high-volume operators like GAMESDRAWS and Lulas BTTS show how large-scale betting systems can generate significant absolute profit, even with lower ROI efficiency.
Conversely, many previously impressive short-term performers fail to maintain their edge over this timeframe, reinforcing a key principle:
👉 consistency over time matters more than peak performance.
Top ROI Tipsters (Last 12 Months – longer-term)
| Rank | Tipster | ROI | Avg Odds | Tips /Week | Win Rate | Profit |
|---|---|---|---|---|---|---|
| 1 | Clean Sheet Merchant | 28.16% | 3.61 | 4 | 38% | 560.40 |
| 2 | The Least Expected | 17.95% | 3.33 | 22 | 36% | 1991.20 |
| 3 | UDIMan | 17.84% | 2.02 | 4 | 56% | 319.40 |
| 4 | Javier Rey | 10.31% | 1.96 | 7 | 53% | 361 |
| 5 | Vic777 | 10.24% | 1.94 | 6 | 51% | 266.22 |
| 6 | MLS Value | 9.62% | 2.29 | 5 | 48% | 213 |
| 7 | SVB Tips | 8.72% | 2.90 | 22 | 40% | 973.20 |
| 8 | BRBETTOR | 8.66% | 2.19 | 8 | 49% | 332.22 |
| 9 | GAMESDRAWS | 8.53% | 14.33 | 29 | 27% | 2201 |
| 10 | Alex Bruno Jubanski | 7.59% | 2.08 | 4 | 53% | 123.45 |
| 11 | Tipingmaster | 7.58% | 1.63 | 8 | 64% | 292.70 |
| 12 | TriBTTS | 7.20% | 9.95 | 20 | 34% | 1270.70 |
| 13 | The LOW Service | 6.75% | 5.53 | 7 | 42% | 409.50 |
| 14 | pinnaclebets | 6.07% | 1.86 | 6 | 53% | 172.50 |
| 15 | Nerbass | 6.02% | 1.96 | 5 | 46% | 131.90 |
Note: Clean Sheet Merchant only has 10 completed months of stats but is included in Tipstrr’s 12-month ROI list.
Combined Timeframe Table Narrative — “The Consistency Benchmark”
If the individual timeframe tables act as filters, this table is the final sieve.
To appear here, a tipster must have demonstrated positive ROI not just over one period, but across three distinct timeframes simultaneously — 3 months, 6 months, and 12 months. That alone eliminates the vast majority of active tipsters.
But the bar is set higher still. Inclusion also requires a minimum of 12 months of tracked results and a 12-month ROI above 5%. This rules out recent hot streaks, short-tenure operators, and anyone whose long-term numbers don’t hold up under scrutiny.
What remains is a small, battle-tested group — tipsters who have navigated variance cycles, weathered cold runs, and maintained structural profitability across changing market conditions.
This is not a list of the highest performers. It is a list of the most durable ones.
👉 Longevity here is not a consolation prize — it is the hardest metric to fake.
This is the benchmark for consistency and sustainability.
| Rank | Tipster | 12M ROI | No. Months Tipping |
|---|---|---|---|
| 1 | Clean Sheet Merchant | 28.16% | 10 |
| 2 | The Least Expected | 17.95% | 14 |
| 3 | UDIMan | 17.84% | 88 |
| 4 | Vic777 | 10.24% | 9 |
| 5 | SVB Tips | 8.72% | 88 |
| 6 | BRBETTOR | 8.66% | 15 |
| 7 | Tipingmaster | 7.58% | 12 |
| 8 | TriBTTS | 7.20% | 36 |
| 9 | The LOW Service | 6.75% | 12 |
| 10 | Mix Mogul Football | 5.97% | 28 |
| 11 | Lulas BTTS | 5.80% | 51 |
| 12 | Spain Football | 5.72% | 14 |
Note: Only those tipsters with over 5% ROI are listed.
Cross-Timeframe Narrative – “The Survivors of All Conditions”
When combining all four timeframes, the dataset becomes a powerful filter of durability. Only a small subset of tipsters appear consistently across 1-month, 3-month, 6-month, and 12-month records.
This elite group includes:
Each of these has passed multiple filters:
- Short-term momentum (1M)
- Emerging consistency (3M)
- Structural validation (6M)
- Long-term sustainability (12M)
However, even within this group, differences are clear:
- The Least Expected and UDIMan show balanced, repeatable edges
- SVB Tips relies heavily on volume
- Footy Star shows clear regression over time
The key insight is not simply who appears in all tables — but how their performance behaves across time.
Final Narrative – “What This Data Really Tells You”
Across all timeframes, one conclusion remains consistent:
👉 Most tipsters are either:
- Short-term variance beneficiaries
- Medium-term opportunists
- Or long-term structurally consistent systems
Very few transition through all three successfully.
The true value is not in identifying the highest ROI at any moment, but in finding:
- Stability across time
- Controlled volatility
- And repeatable performance logic
That’s why names like The Least Expected, UDIMan, and Clean Sheet Merchant consistently reappear — not because they are perfect, but because they are survivors of multiple statistical environments.