My goal is simple: find tipsters that actually make money and combine them into portfolios that reduce the ‘noise’ of losing streaks.
After analyzing dozens of services, two football tipsters – Clean Sheet Merchant (CSM) and The Least Expected (TLE)- rose to the top. By running them through a Monte Carlo simulation, I found that they don’t just perform well – they are perfectly engineered to complement each other.
The Starting Point
The big money might be in Horse Racing tipsters but getting the advised odds can be a headache. Football odds are deeper, more liquid, and significantly easier to get on.
I recently took a hard look at three football tipsters I’ve been keeping an eye on:
- Clean Sheet Merchant (CSM)
- TipingMaster (TM)
- The Least Expected (TLE)
Could they make an efficient portfolio?
To separate signal from noise, I ran a Monte Carlo simulation on their combined 11-month, 1,500+ tip history.
While all three were profitable, their individual Monte Carlo profiles varied wildly:
| Tipster | Bets | Expected ROI | Win Prob (%) |
| CSM | 244 | 22.80% | 99.6% |
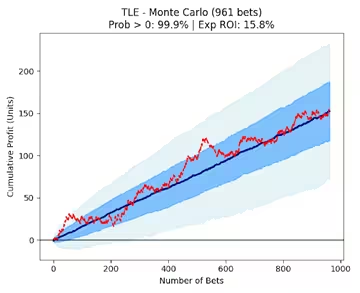
| TLE | 961 | 15.93% | 99.9% |
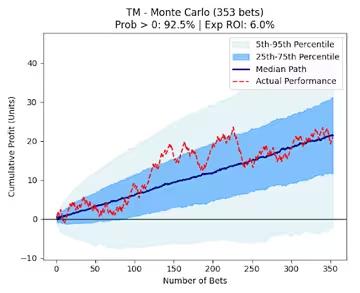
| TM | 353 | 6.01% | 92.5% |
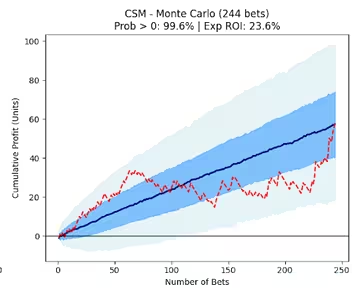
How to Read The Monte Carlo Charts
Understanding The Monte Carlo Charts
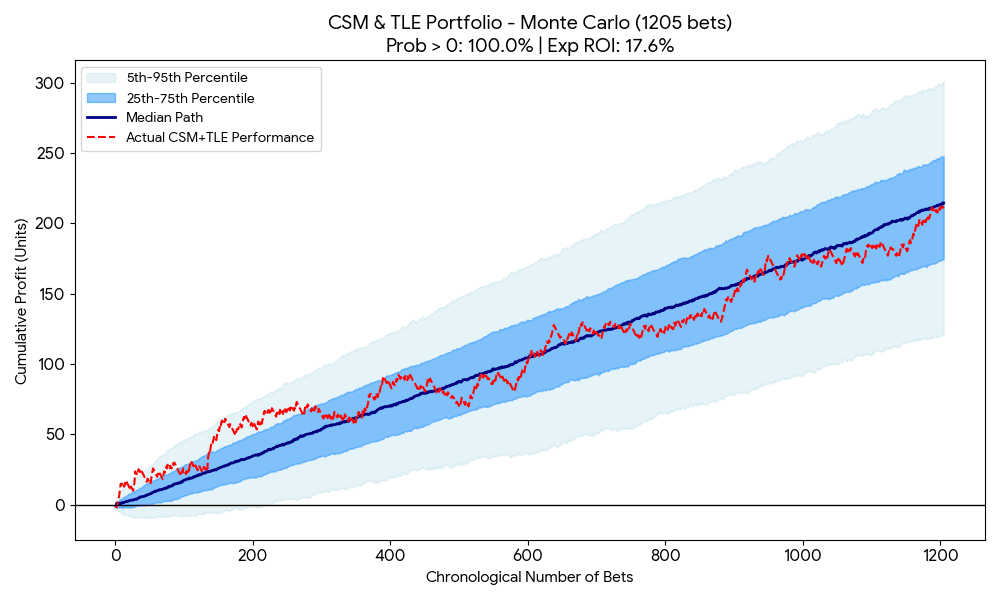
The charts show the “Fan Charts” for each tipster.
- The navy line represents the most likely (median) path.
- The dark blue bands show the typical, most common outcomes (25th to 75th percentile) – this is the “normal” range of variance.
- The light blue bands represent the worst-case and best-case scenarios (the extreme 5th to 95th percentiles).
- The red dashed line traces the actual historical profit path they took to get to their current totals.
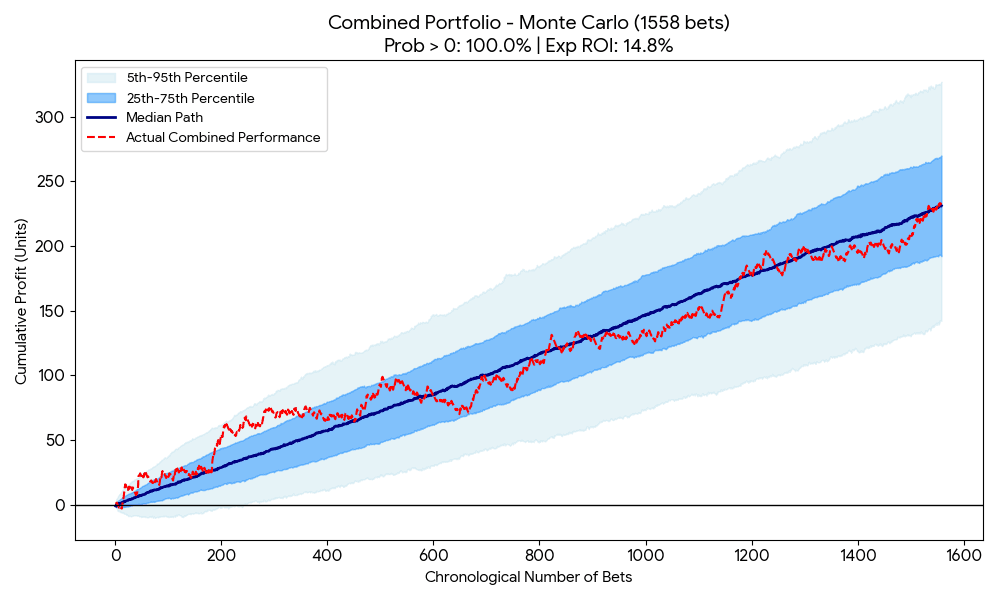
The Three Tipster Portfolio
The combination of the three tipsters showed the following encouraging profile – a Statistically Projected Long-Term Profitability of 100% and an Expected ROI of 14.8% from 1558 bets.
N.B. In statistics, nothing is 100% guaranteed. View these figures as the ‘projected probability’ based on the historical edge of these services.
The Optimization: Pruning for Efficiency
The results were positive, but the simulation revealed an inefficiency: TM.
While TM was profitable, its ~6% ROI and higher volatility acted as a drag on my capital efficiency.
By pruning TM, the Statistically Projected Long-Term Profitability stayed at 100% but the other numbers shifted significantly for the better:
- Expected ROI: Jumped from ~14.8% to 17.6%.
- Efficiency: Achieved the same objective with 22% fewer bets.
But Did Pruning Actually Create a Problem?
You might assume CSM and TLE are highly correlated because both operate in the BTTS (Both Teams To Score) market. However, after analyzing their 595 combined selections, the data tells a different story:
- Overlap: Only 3 bets overlapped (0.5%).
- Contrasting Edges: CSM backed “BTTS-Yes” in 96% of cases; TLE backed “BTTS-No” in 91% of cases.
They aren’t competing; they are complementary.
The Optimized Portfolio (CSM + TLE)
By focusing exclusively on these two, I’ve constructed a leaner, sharper engine:
- Expected ROI: 17.6%
- Projected Long-Term Profitability: High (Model-validated)
- Optimal Allocation: CSM (57.6%) | TLE (42.4%)
Conclusion
I’ve learned that the “flat stretches” in a tipster’s history are just the nature of variance. As long as the edge is statistically sound, you have to trust the simulation over the short-term noise.
Data-driven betting isn’t about picking winners—it’s about mathematically constructing the most efficient path to success.
By allocating capital to CSM’s sharp edge and using TLE as the volume engine, this portfolio is designed to grow, not just survive.
Disclosure: I am an affiliate for the services mentioned. I only recommend tipsters I personally track, analyze, and use in my own portfolio. My performance data is based on my own bankroll tracking.